West Elizabeth, Pennsylvania
West Elizabeth, Pennsylvania | |
|---|---|
 Fifth Street | |
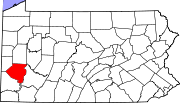
 Location in Allegheny County and the U.S. state of Pennsylvania. | |
| Coordinates: 40°16′22″N 79°53′42″W / 40.27278°N 79.89500°W | |
| Country | United States |
| State | Pennsylvania |
| County | Allegheny |
| Area | |
• Total | 0.24 sq mi (0.63 km2) |
| • Land | 0.18 sq mi (0.46 km2) |
| • Water | 0.07 sq mi (0.17 km2) |
| Population | |
• Total | 403 |
| • Density | 2,251.40/sq mi (871.44/km2) |
| Time zone | UTC-5 (Eastern (EST)) |
| • Summer (DST) | UTC-4 (EDT) |
| ZIP codes | 15088 |
| FIPS code | 42-82848 |
West Elizabeth is a borough in Allegheny County, Pennsylvania, United States. The population was 403 at the 2020 census.[3]
History
[edit]
The town was initially laid out in 1833, and incorporated March 3, 1848.[4] West Elizabeth was a coal mining and boat-building town. Coal was transported by barge down the Monongahela River to industries in Pittsburgh. Coal was transported from the mine to the river by Walton's Coal Incline and the O'Neil and Company Incline.
Geography
[edit]West Elizabeth is located at 40°16′22″N 79°53′42″W / 40.27278°N 79.89500°W (40.272901, −79.894918).[5]
According to the United States Census Bureau, the borough has a total area of 0.3 square miles (0.78 km2), of which 0.2 square miles (0.52 km2) is land and 0.1 square miles (0.26 km2), or 27.59%, is water.
Surrounding and adjacent neighborhoods
[edit]Situated along the Monongahela River, West Elizabeth is surrounded by Jefferson Hills. Across the river, West Elizabeth runs adjacent with the borough of Elizabeth and has a direct connector via Malady Bridge.
Demographics
[edit]| Census | Pop. | Note | %± |
|---|---|---|---|
| 1850 | 328 | — | |
| 1860 | 364 | 11.0% | |
| 1870 | 590 | 62.1% | |
| 1880 | 838 | 42.0% | |
| 1890 | 719 | −14.2% | |
| 1900 | 747 | 3.9% | |
| 1910 | 841 | 12.6% | |
| 1920 | 890 | 5.8% | |
| 1930 | 1,074 | 20.7% | |
| 1940 | 1,297 | 20.8% | |
| 1950 | 1,137 | −12.3% | |
| 1960 | 921 | −19.0% | |
| 1970 | 848 | −7.9% | |
| 1980 | 808 | −4.7% | |
| 1990 | 634 | −21.5% | |
| 2000 | 565 | −10.9% | |
| 2010 | 518 | −8.3% | |
| 2020 | 403 | −22.2% | |
| U.S. Decennial Census[6] | |||
As of the 2000 census,[7] there were 565 people, 247 households, and 153 families residing in the borough.
The population density was 2,764.6 inhabitants per square mile (1,067.4/km2). There were 279 housing units at an average density of 1,365.2 per square mile (527.1/km2).
The racial makeup of the borough was 99.29% White, 0.18% African American, 0.35% Asian, and 0.18% from two or more races.
There were 247 households, out of which 28.3% had children who were under the age of eighteen living with them; 38.1% were married couples living together, 17.4% had a female householder with no husband present, and 37.7% were non-families. Out of all of the households that were documented, 34.0% of were made up of individuals, and 13.0% had someone living alone who was sixty-five years of age or older.
The average household size was 2.29 and the average family size was 2.92.
Within the borough, the population was spread out, with 22.5% of residents who were under the age of eighteen, 7.6% who were aged eighteen to twenty-four, 31.2% who were aged twenty-five to forty-four, 21.9% who were aged forty-five to sixty-four, and 16.8% who were sixty-five years of age or older. The median age was thirty-seven years.
For every one hundred females, there were 86.5 males. For every one hundred females who were aged eighteen or older, there were 84.8 males.
The median income for a household in the borough was $26,339, and the median income for a family was $32,500. Males had a median income of $36,667 compared with that of $19,712 for females.
The per capita income for the borough was $14,687.
Approximately 9.4% of families and 15.5% of the population were living below the poverty line, including 22.1% of those who were under the age of eighteen and 13.1% of those who were aged sixty-five or older.
Government and politics
[edit]| Year | Republican | Democratic | Third parties |
|---|---|---|---|
| 2020 | 59% 116 | 39% 77 | 1% 2 |
| 2016 | 62% 103 | 38% 64 | 0% 0 |
| 2012 | 54% 98 | 44% 81 | 2% 4 |
References
[edit]- ^ "ArcGIS REST Services Directory". United States Census Bureau. Retrieved October 16, 2022.
- ^ "Census Population API". United States Census Bureau. Retrieved October 12, 2022.
- ^ "Explore Census Data".
- ^ Warner, A. (2008). History of Allegheny County Pennsylvania. Heritage Books. pp. 82–84. ISBN 9780788446146.
- ^ "US Gazetteer files: 2010, 2000, and 1990". United States Census Bureau. February 12, 2011. Retrieved April 23, 2011.
- ^ "Census of Population and Housing". Census.gov. Retrieved June 4, 2016.
- ^ "U.S. Census website". United States Census Bureau. Retrieved January 31, 2008.
- ^ EL. "2012 Allegheny County election". Pittsburgh Tribune-Review. Retrieved October 15, 2017.
- ^ EL. "2020 Allegheny County General Election". Retrieved November 11, 2021.
- ^ "Election Night Reporting".

